More than half of the world’s population lives in cities and that percentage continues to rise, making cities critical areas for adopting practices to preserve natural resources.

How green is your city? How does it match up to other cities? Is it making progress in becoming more sustainable?
There is no definitive list but we may be moving toward clearer answers to these questions. An exciting body of work is coming up with ways to measure the environmental impact of cities. Let’s look at three.
Land, energy, water
The ecological footprint measures how much land and water area a city requires to produce the resources it consumes and to absorb its wastes.
Ecological footprint is measured in global hectares (gha) per capita. The global average is around 2.6. The footprint of London UK, for example, was measured at 4.5, slightly lower than the UK average of 4.6. More people in London use public transport than almost any other city in the UK, reducing the relative size of its footprint.
When the data are broken down by neighbourhood, the biggest footprints are found in higher-income areas where residents have larger homes and are more likely to have private automobiles. In San Francisco, the value was calculated at 7.1 gha while in Calgary, Canada the value was 9.8 gha. Winters are cold in Calgary and most people use cars to get around.
Another measure is a city’s carbon footprint, which is the total amount of greenhouse gases it produces. The basic unit is kg or ton of CO2. The global average is 1.19 metric tons per person. One 2010 study measured the carbon footprint of 12 cities: Beijing, Jakarta, London, Los Angeles, Manila, Mexico City, New Delhi, New York, São Paulo, Seoul, Singapore and Tokyo. The number included direct emissions from the metropolitan area, as well as emissions produced in the metro area but consumed elsewhere, such as goods manufactured in cities.

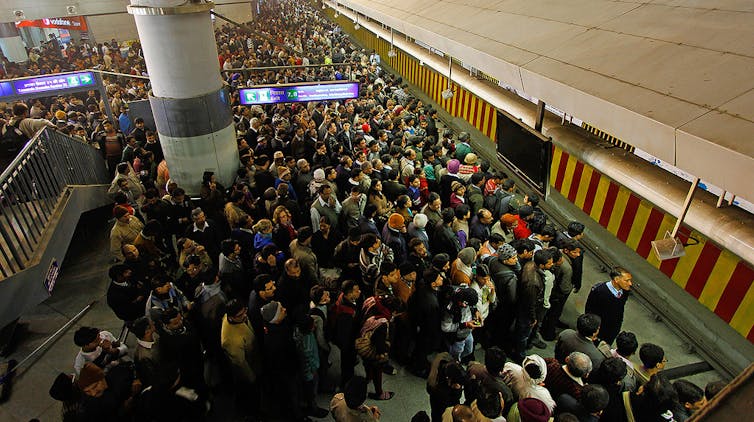
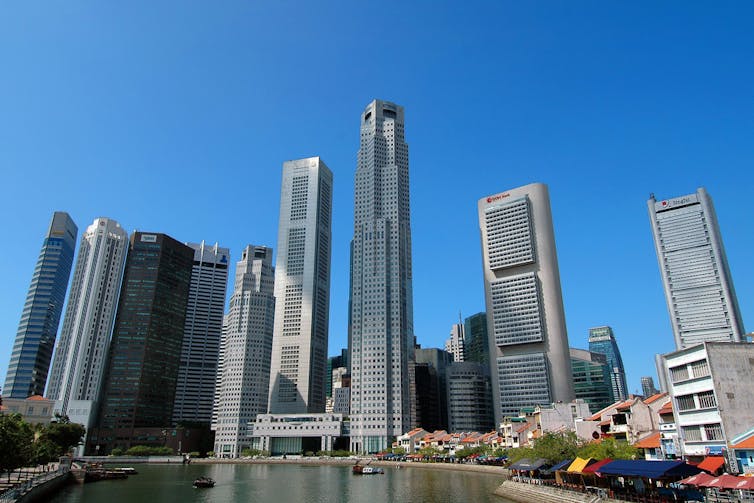
Four of the cities have footprints smaller than the global average: Delhi, Manila, Sao Paulo and Beijing, in part because of relatively high usage of public transportation. London was close to the global average, while Los Angeles had by far the largest, followed by Singapore, New York and Mexico City.
Another study from 2009 measured the carbon footprint of the largest 100 metro areas in the US and found the higher-density metro areas had the smallest footprint. An even more recent study of all US households found that those in suburban areas had a much higher footprint than those in the larger cities.
The water footprint of a city is a measure of all the freshwater used to produce all the goods and services consumed in the city. This is a very difficult metric to compute because it includes the volume of freshwater consumed from surface water and ground water, the volume of rainwater consumed and the volume of freshwater used to dilute the pollutants created by the production of all goods and services for the city.
Studies that assessed the footprint of Milan, Italy and Lijiang City, China showed how the increasing footprint was straining those cities’ water supplies.
Imperfect measures but a start
These metrics are still in the early stages of development. There are lots of problems, including assessing the leakage of impacts from outside the city’s boundaries; the quality of data, which is too often imprecise and collected at different times for other purposes; and the lack of comparability between studies. The work is more embryonic than definitive. For example, we have yet to agree upon standard protocols for the data used and methods employed.
While the three metrics have problems in estimation and calibration, they constitute a start. Even at this still rudimentary stage, they provide some startling findings. Notably, these initial studies show that larger cities have smaller carbon footprints than smaller cities. And higher density cities have lower carbon footprints.

As we transition into a more urban future, this is cause for some hope and could offer direction on effective city planning. Certain urban forms reduce the carbon footprint; these include more compact urban growth, more mass transit and greater use of cleaner, more sustainable energy supplies for buildings and transportation.
We need to refine these metrics, develop new ones and so create a standardized and easily understood index of city sustainability. Perhaps the protocols for developing a city sustainability index should be on the agenda at the United Nations Climate Change Conference to be held in Paris later this year.
With better data and a standard index, policies can be evaluated, targets set and institutions held to account. By comparing these metrics, planners and citizens can see how sustainability-related factors correlate to how livable cities are. And a robust city sustainability index would benchmark where we are now and provide a measure of progress in the future.
John Rennie Short, Professor, School of Public Policy, University of Maryland, Baltimore County
This article is republished from The Conversation under a Creative Commons license. Read the original article.


